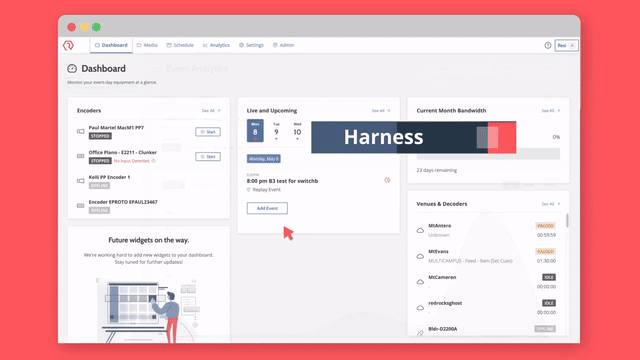
Real-Time Analytics
Your audience data — live, on-demand, and social — all in one place.
Trusted by thousands of organizations across faith, education, government, events, and more.

Real-Time Monitoring
See who’s watching while the stream is still live.Seamless Data Access
Live, on-demand, and social performance in a single dashboard.Precision Decision-Making
Share data with your team in Excel or Google Sheets in seconds.Library Analytics: Understand How Your On-Demand Content Performs
Your on-demand content keeps working long after the stream ends — Library Analytics tells you how well. Get a detailed view of your full video library, from individual clip performance to big-picture trends that inform what you produce next.
- Examine individual video metrics at a granular level
- Big-picture summaries of library-wide performance
- Pinpoint content to improve, retire, or replicate
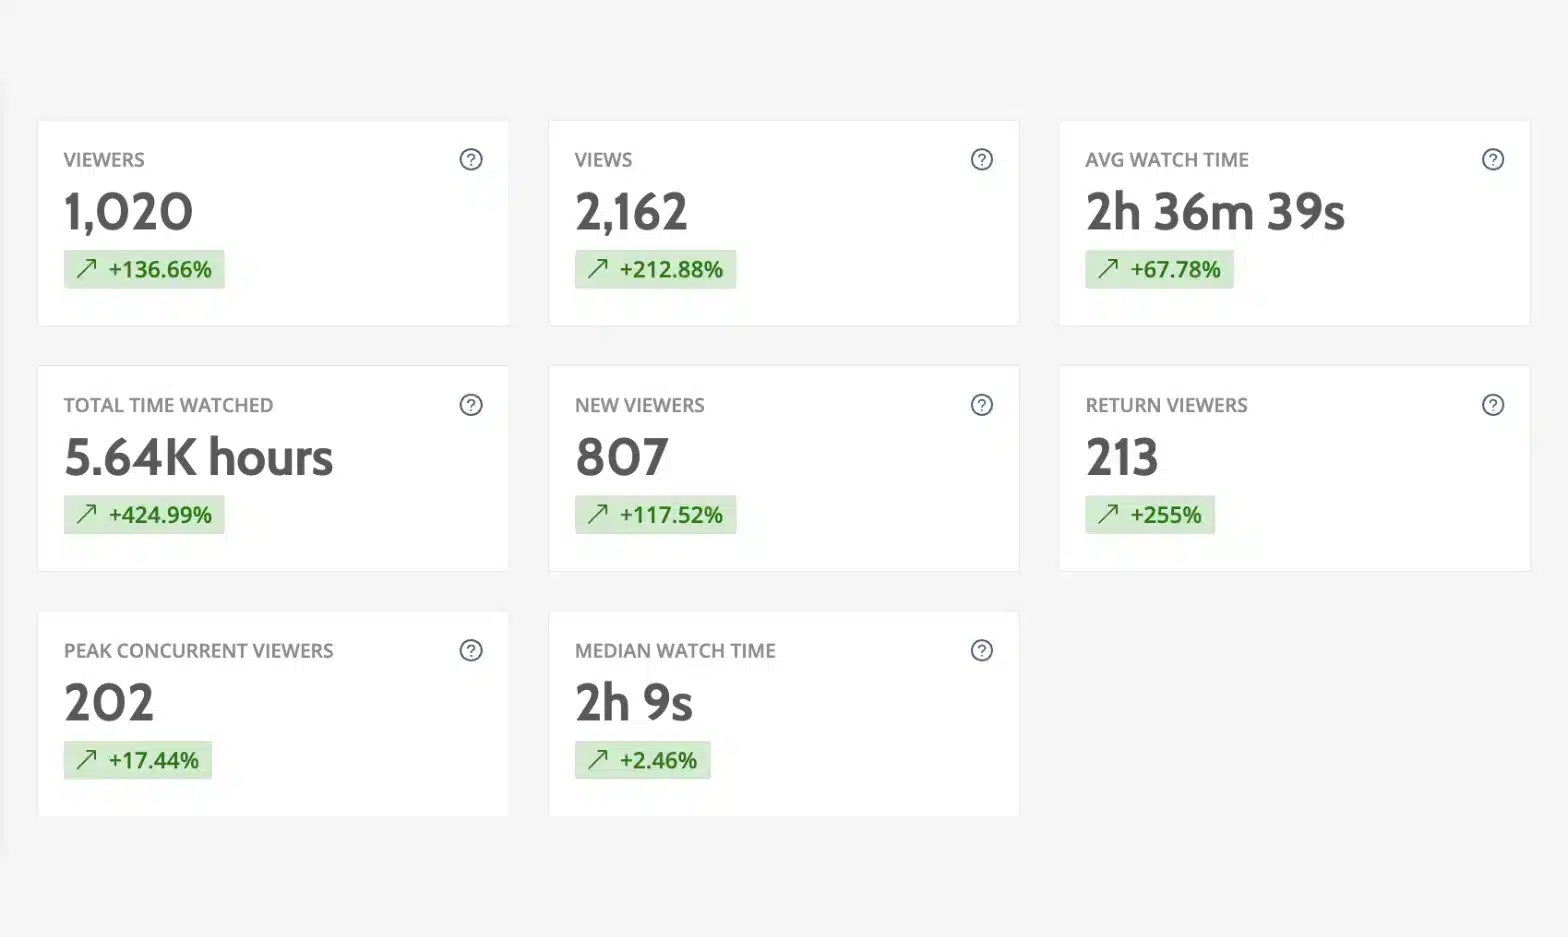
Watch Time and Viewer Breakdown: See Who Stayed and Why
Knowing someone watched is just the beginning. Watch Times and Viewer Breakdown show you who stayed, when they left, and what kept their attention — filterable by location, device type, resolution, and more.
- Filter viewer data by location, device type, resolution, and more
- Spot real-time viewership spikes and drop-offs as they happen
- Identify the exact moments that resonated — and replicate them
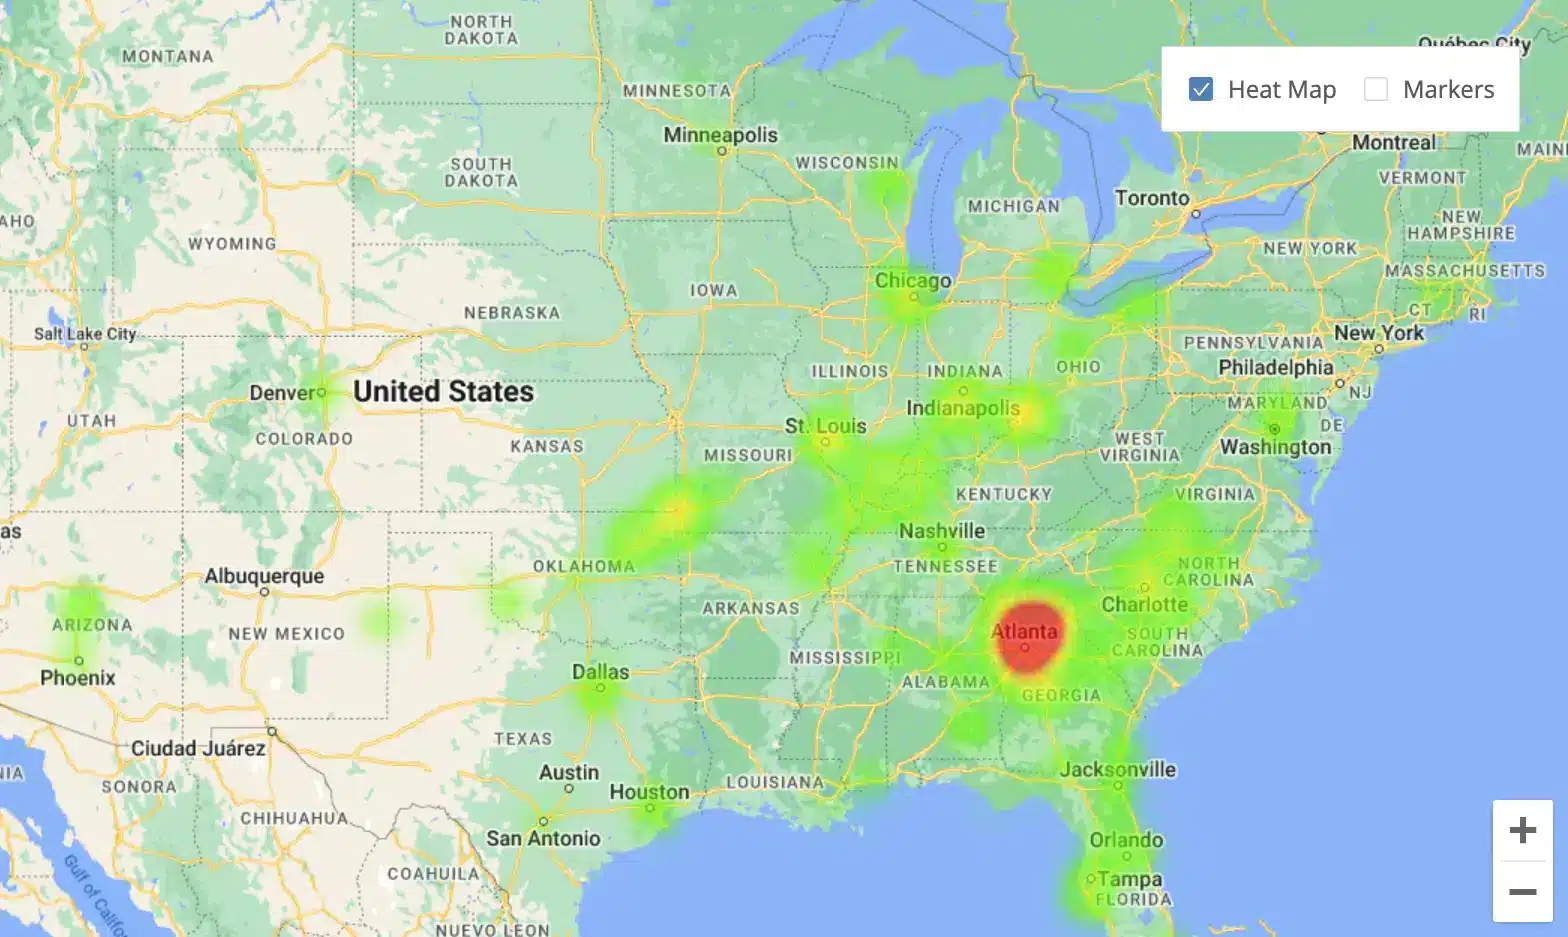
Live Streaming Heat Maps: Track Your Audience Locations in Real Time
Where are your viewers actually watching from? Heat Maps visualize your audience locations as they engage — not after the fact. Use regional data to focus outreach, shape programming, and understand the communities you’re reaching through live streaming.
- Identify regional viewer clusters and audience hubs in real time
- Tailor topics and outreach to specific geographic areas
- Use location data to guide content strategy and audience growth

Export Data
Transfer viewer data into Excel or Google Sheets — formatted and ready to share with leadership without rebuilding a report from scratch.
Instant Delivery
No delayed post-event reports. Analytics are ready when the stream ends, so your team can debrief with data, not assumptions.
Social Analytics
See how your content performs on Facebook directly inside Resi — no third-party integration required, and no switching between your RTMP destinations and a separate dashboard.
Start Streaming With Real-Time Audience Analytics
See the full Resi platform in action — including Real-Time Analytics, Media Sites, and every feature built to help you reach and understand your audience.
Still have questions? We have answers.
Platform dashboards only show you data from their own platform — and only after the event. Resi Analytics brings your website stream, on-demand library, and social performance together in real time, inside the same platform where your content already lives. No reconciling separate reports. No manual data consolidation.
It’s built in. Real-Time Analytics is a native part of the Resi platform — not an add-on to configure or a third-party tool to integrate. If you’re on Resi, it’s already there.
Yes. Social Analytics for Facebook is available directly inside Resi with no external integration required. Monitor social performance alongside your live stream and on-demand data without leaving the platform.
No. The dashboard is built for production staff and communicators — high-level summaries are visible at a glance. If you need to share results with leadership, the export to Excel or Google Sheets takes seconds. The same Resilient Streaming Protocol that powers your stream is engineered to work without dedicated technical oversight — and so is the analytics built around it.

